Last week’s post promised a deep dive into each of our three new dashboards. Let’s start with our asset intelligence view.
As discussed last week, what made the cut on each dashboard was guided by Peter Drucker’s 1967 advice (from “The manager and the moron,”):
The question one must ask is not “How many figures can I get?” but “What figures do I need? In what form? When? And how? What are the thinking tasks that the display is supposed to help with?”
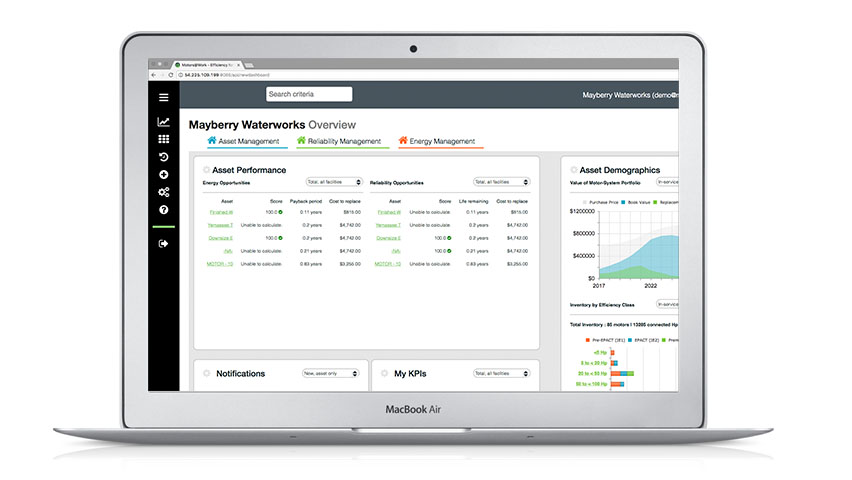
We designed our asset intelligence view to support asset managers, capital planners, and budget officers while providing some KPIs and other performance statistics that executives may find insightful. The “thinking tasks” the dashboard helps with include:
1. What assets should I replace this year?
The Asset Performance portlet, found front and centre, shows which motors need replacement soon to head off reliability issues. Motors@Work also lists which motors would benefit from replacement because they’re so inefficient that you can pay-back their replacement with the energy savings.
2. What is the value of my motor-driven systems?
I’ll admit, this is probably the one question I’ve never heard a client ask; however, it’s one I frequently ask that few clients or prospects can answer. Regardless, it’s one you should pay attention to; and that’s why Motors@Work includes this value in the Asset Demographics portlet.
The value of your motor-driven systems factors into your return-on-asset metrics. Your plants and equipment — particularly critical motors, pumps, fans, and compressors — must operate for you to produce goods and earn revenue. This metric and its trend highlights whether you’re reinvesting in your facilities and equipment or letting it degrade and depreciate. Also, when compared to your total assets line, this metric shows whether your assets lie in liquid capital or physical assets.
3. How much do I need to budget for future motor-driven asset replacements & when?
The first graph under the Asset Demographics portlet projects your budget for motor replacement for the coming ten years. These projections calculate the most cost-effective point to replace each motor in your inventory — after it’s fully depreciated but before its maintenance and operations costs escalate.
4. What is the condition of my motor-driven assets?
The second and third graphs on the Asset Demographics portlet provide information on the condition and performance of your motor-driven system inventory. How many motors do you have certain sizes? How efficient are they relative to what’s currently available on the market? And which ones are the biggest energy hogs?
5. What needs attention today?
The Notifications portlet — contained on all three dashboard screens — highlights your most recent alerts, with the newest and most severe first. At a glance, you’ll see what needs your attention — whether it’s a motor performing poorly, or a utility bill that needs review.
6. How are we performing? Which way are we trending?
With the addition of new sparkline graphs, the KPIs portlet helps staff throughout the organization quickly see which way key indicators are trending over the past twelve months. We’ve populated the portlet with some initial indicators that our clients requested; however, we can also help you customize this portlet to show the indicators your organization tracks.
Want to test drive the new asset intelligence dashboard? Email Nicole at info@motorsatwork.com to schedule your Motors@Work demo today.