It’s 4:19 pm when you notice two new notifications in your inbox:
“Motors@Work detects Fan Motor #3 operating at 3% below design efficiency; investigate cause.”
“Motors@Work detects Condensate Return Pump #2 operating at 2.5% below design efficiency; investigate cause.”
Most customers receive this alert at some point during our condition-monitoring service. Some customers see it right when they begin monitoring a motor that’s been rewound a few times — losing efficiency each time — because Motors@Work provides that motor’s first functional efficiency test since rewind.
Others see it when their motor or its attached system component (i.e., fan, pump, compressor, conveyor) needs service. After all, efficiency serves as the leading indicator that the motor is working harder to produce the same output — with studies finding small reductions in efficiency statistically significant.[i]
Here’s how Motors@Work can help you identify, troubleshoot, and resolve motor efficiency issues that otherwise would have gone undetected without our timely condition-monitoring alerts.
You go to the Motors@Work tab on this asset’s record and click the graph to plot efficiency measurements over time. Recirculation Pump #2 operates at a constant load, so the downward trend in efficiency over the past three months is readily apparent. To figure out why, you assign Motors@Work’s auto-generated work request to a technician.
Unlike Recirculation Pump #2, Fan Motor #3 operates over a wide range of loads. Plotting efficiency over time doesn’t help you to identify the trend.
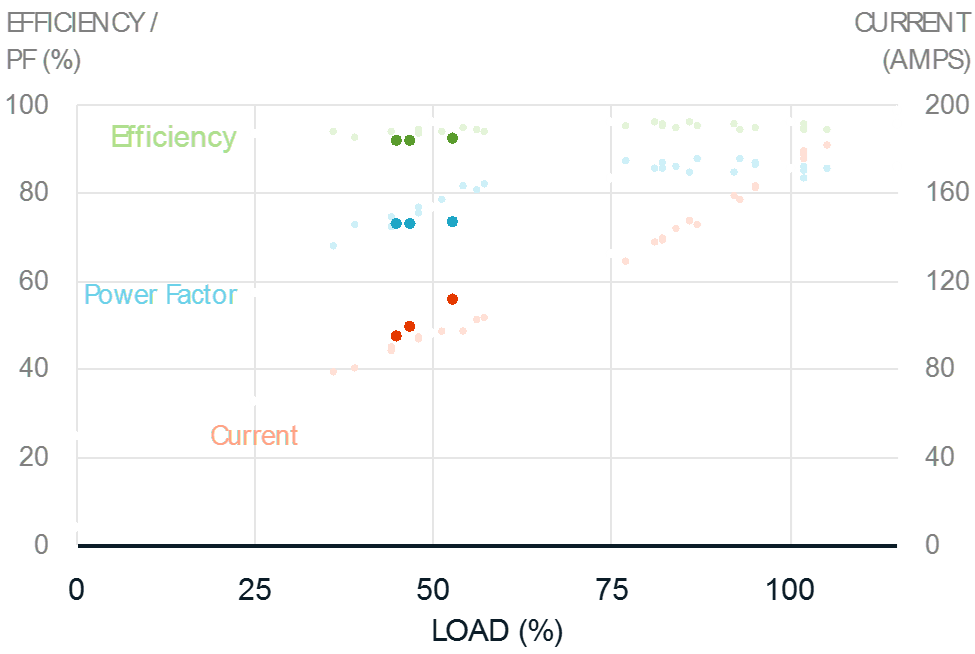
As discussed in a previous post, motor efficiency varies by load. So, how does Motors@Work determine your motor’s design efficiency at less-than-nominal loads?
In short, we rely on Motors@Work’s proprietary catalog of 47,000 motors. In addition to maintaining nameplate information on these motors, Motors@Work’s catalog includes OEM performance test results. If we have your motor in our catalog, then we know how your motor’s efficiency varies with load. If not, we know how similar motors — those with the same design, size, speed, frame, enclosure, voltage, and insulation type — behave at various load points. Then, applying statistics to account for model and manufacturing variations, we can determine with fairly high certainty
Plotting efficiency versus load helps you see that this reading is much lower than previous efficiency measurements at the same load point. Again, you assign the Motors@Work-generated work request to a technician to investigate.
 A few days later, you see that the work requests have been completed. The technician found a partially clogged suction filter on Recirculation Pump #2. Since you don’t have a suction-side pressure gage, motor energy use — and loss of efficiency — is the only way to know this filter needs maintenance. Another technician found that someone partially closed the baffle on Fan Motor #3 — making the motor work harder while reducing downstream air flow rates, and therefore, efficiency.
Motors@Work’s continuous, near-real-time condition monitoring algorithms watch for efficiency drops and send out content-rich alerts that facilitate troubleshooting — so you can operate your motor-driven systems at their lowest energy cost.
How will condition monitoring benefit your organization? Email Nicole at info@motorsatwork.com to learn more.
[i] B. Lu, T. G. Habetler and R. G. Harley, “A Survey of Efficiency Estimation Methods for In-Service Induction Motors,” IEEE Transactions on Industry Applications 42.4 (2006).